
Weather Activities for 3rd Grade: Climate and Hazards
Weather activities for 3rd grade cover some of the most naturally engaging science content in the elementary curriculum. Students already have opinions about the weather, and NGSS standards 3-ESS2-1, 3-ESS2-2, and 3-ESS3-1 provide teachers with a framework to turn that curiosity into real scientific thinking. Across this unit, students move from recording daily weather patterns to comparing global climates to designing solutions for weather-related natural hazards.
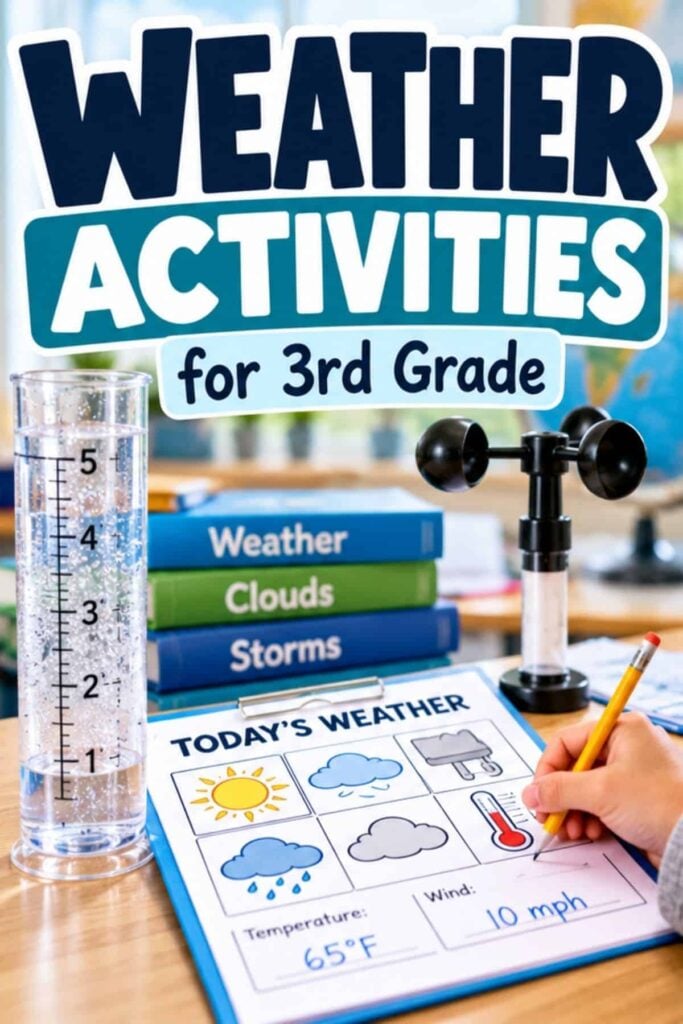
This post pulls together hands-on activities, videos, and resources to help you build a coherent, engaging weather and climate unit.
What Students Learn About Weather and Climate in 3rd Grade
The three standards in this unit build on each other in a logical progression. 3-ESS2-1 asks students to represent weather data in tables and graphs to identify seasonal patterns.
This is where weather journaling, graphing activities, and data collection live. 3-ESS2-2 shifts from local patterns to global comparison: students research and describe climates in different regions of the world, discovering that climate is not just what the weather is today but what it typically is across seasons and years.
3-ESS3-1 brings in an engineering lens: students evaluate design solutions that reduce the impact of weather-related hazards like floods, hurricanes, and drought.
By the end of a well-sequenced unit, students should be able to:
- Record and graph weather data across multiple days or seasons
- Explain the difference between weather (daily conditions) and climate (long-term patterns)
- Compare climates in different regions using research and maps
- Identify weather-related natural hazards and describe how humans reduce their impact
- Make and support a claim about a design solution for a weather hazard
Hands-On Weather Activities for 3rd Grade
Water Cycle in a Tub
Fill a covered plastic tub with a cup of hot water at one end and a cup of ice at the other. Students observe evaporation rising from the hot water and condensation forming over the ice, a complete water cycle in a container.
For added depth, add a habitat to the tub: a patch of grass, a layer of sand, a “mountain” built up under the ice. Students record observations over several minutes and connect what they see to vocabulary related to precipitation, evaporation, and condensation. This activity pairs well with the cloud-in-a-jar investigation, which provides students with another concrete model of condensation in action.
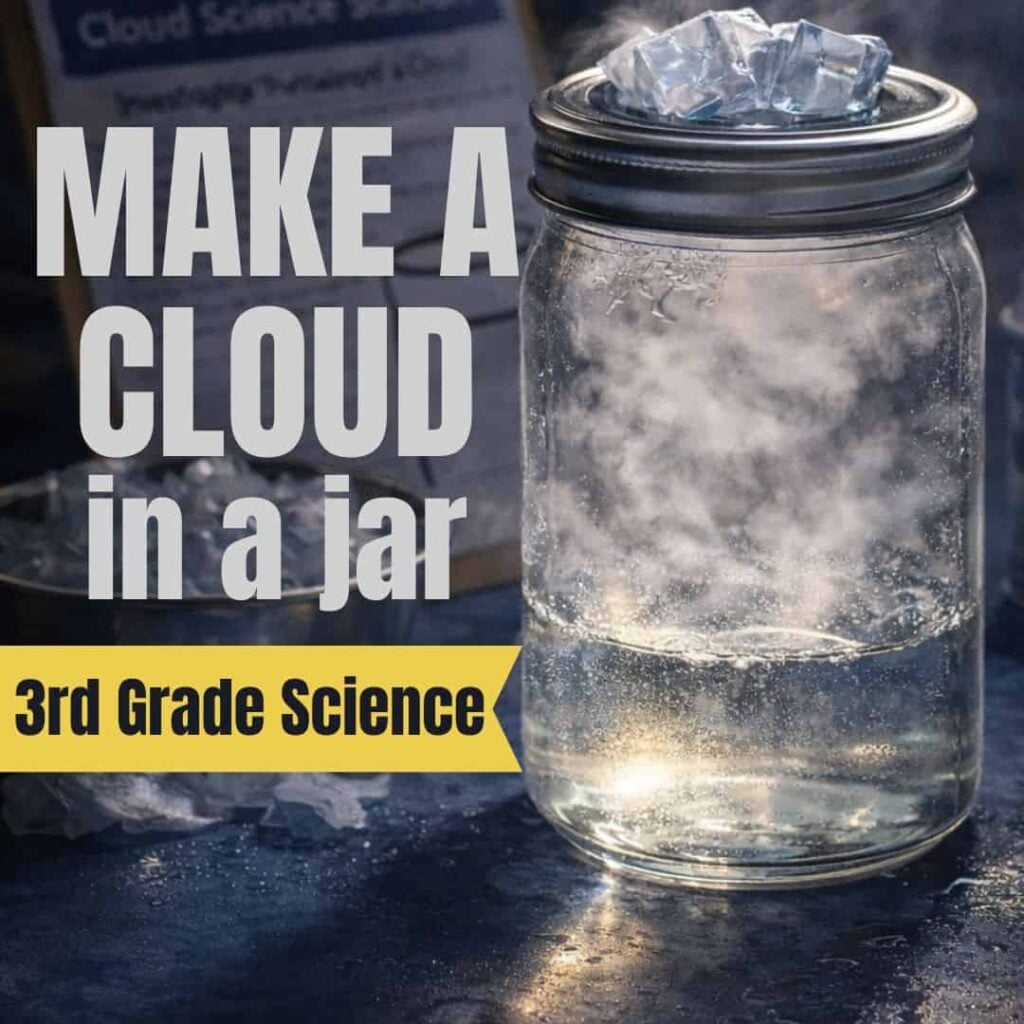
The cloud in a jar investigation is a smaller version of the water cycle in a tub activity.
Graph Evaporation Rate
Place several drops of water in a circle on black paper, then trace the outline with chalk. Every minute, redraw the circle around the shrinking wet spot. Students see the data change in real time and record each observation in a table. For a comparison extension, set up two trials, one under a heat lamp and one without, and have students graph both on a line graph.
This is a strong 3-ESS2-1 activity because it puts data collection and graphical display directly in students’ hands rather than having them just read a pre-made chart.
Weather Maps Activity
Collect weather maps from newspapers or online sources from different parts of the world. Students learn to read standard weather map symbols, then compare conditions across regions on the same day and track changes across several days. From the multi-day comparisons, students make inferences about an area’s typical climate, connecting the 3-ESS2-1 data representation standard directly to the 3-ESS2-2 climate comparison standard.

The hands-on weather maps activity on this site provides students with a structured science station for practicing reading and diagramming weather maps. A meteorologist explaining weather maps makes a strong video companion before students work independently.
Precipitation Brochure
Students create a brochure showing the different types of precipitation, rain, snow, sleet, and hail, covering what causes each, how they form, and the weather hazards they can create. This serves as a research, writing, and science task simultaneously. It also naturally sets up the 3-ESS3-1 engineering standard: once students understand how different types of precipitation create hazards, they are ready to evaluate solutions to reduce those hazards.
Rainshadow Effect Diorama
Students build a diorama showing how mountains create a rainshadow, moist air rises and cools on the windward side, dropping precipitation, while the leeward side stays dry. This is one of the most concrete ways to help students understand why climates vary over short geographic distances, and it supports the 3-ESS2-2 standard for comparing climates across different regions. The physical building process provides students with a spatial model they can refer to when discussing climate data.
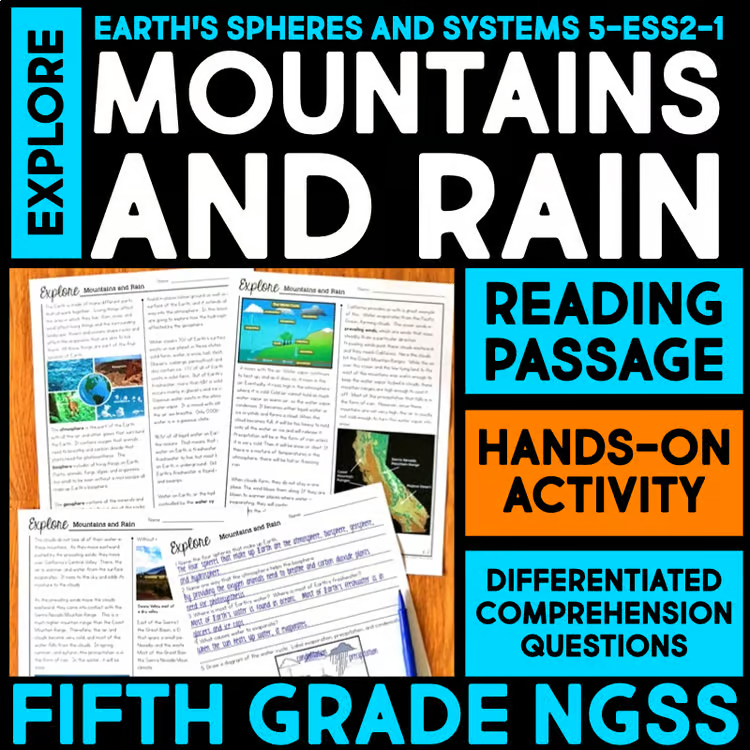
This hands-on science station combines informational text with data analysis and critical thinking to help students understand how the geosphere impacts the hydrosphere through mountains, precipitation, and rain shadows.
Map Ocean Currents and Wind Patterns
Students research and map global wind and ocean currents, then examine the relationships between them. This activity builds the geographic reasoning that underlies climate comparison in 3-ESS2-2. Students begin to see why coastal climates differ from inland ones, and why some regions are far warmer or cooler than their latitude would suggest.
Pairing this with an investigation of El Niño on NASA Climate Kids shows students a real-world example of how changes in ocean temperature drive weather shifts across entire continents.
Cloud Observation Journal
Observing clouds daily and recording them in science journals is one of the simplest and most effective weather data collection routines for 3-ESS2-1. Students sketch cloud types, record weather conditions, and begin to notice patterns over time. Some cloud types reliably precede rain, others signal fair weather.
Spread over a week or two, the journal builds a dataset that students can then represent in the tables and graphs required by the standard. This also pairs naturally with weather vocabulary activities that build the specific language students need to describe their observations.
Engineering Design: Weather Hazard Activities
3-ESS3-1 asks students to make a claim about the merit of a design solution that reduces the impact of a weather-related hazard. The keyword is “claim.” Students aren’t just building a solution; they’re evaluating one and using evidence to support their thinking.
Flood Simulation
Before asking students to design flood-reduction solutions, show them a flood-simulation video to build a shared model of how flooding occurs and what it damages. Then students can evaluate design solutions, levees, raised structures, permeable surfaces, and make evidence-based claims about which approach is most effective and why. The “why” is the important part for 3-ESS3-1.

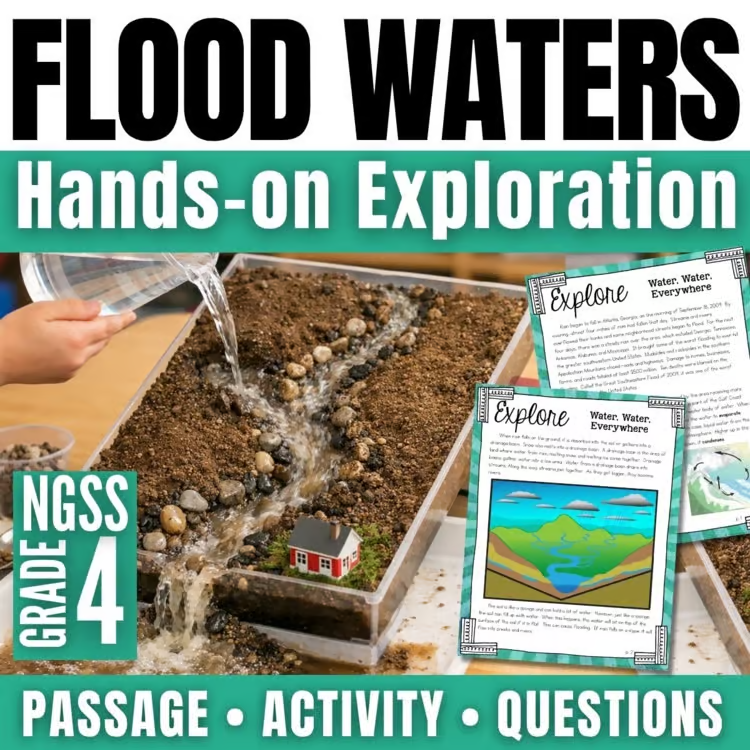
Help your students explore the powerful effects of natural disasters with this engaging flooding science station, designed to build understanding through reading, hands-on investigation, and critical thinking.
Hurricane Tracking
Students investigate how meteorologists track hurricanes and, during tropical storm season, track real storms as they develop and move. Mapping a storm’s path over several days gives students direct experience with how scientists use data to predict hazards and how those predictions drive human decisions about evacuation and preparation. A Venn diagram or T-chart comparing tornadoes and hurricanes (and different types of winter storms) helps students organize what they know about each hazard before evaluating design solutions for them.
Drought Research
Students research current drought conditions around the world and investigate how drought affects the people living in those areas. This grounds the 3-ESS3-1 standard in human impact, not just “weather is interesting” but “weather changes people’s lives, and design solutions matter.” Students can evaluate drought-response solutions (such as irrigation systems, drought-resistant crops, and water conservation infrastructure) and make claims about their effectiveness.
Videos to Support Your Weather and Climate Unit
Short videos work well as unit hooks, vocabulary builders, or consolidation tools after investigation. These are organized by purpose:
- Weather and Climate overview: Scholastic’s StudyJams Weather and Climate series includes 13 interactive slide shows and videos — a strong resource for the full unit.
- NatGeo Kids playlists: Two curated weather and climate playlists from National Geographic Kids — well-produced and accessible for 3rd grade.
- Crash Course Kids and SciShow Kids: Both channels have multiple weather and climate videos on YouTube, running 3–5 minutes each. Good for specific vocabulary concepts like evaporation, condensation, or climate zones.
- NASA on predicting weather: This NASA video connects weather prediction to the data collection students are doing in 3-ESS2-1 — showing them the real science behind weather forecasting.
- FEMA severe weather safety: The FEMA video on severe weather connects directly to 3-ESS3-1 — students see how design and preparation reduce the impacts of weather hazards in the real world.
- Engage activity: Have students make thunder in a paper bag as a quick, memorable unit opener that immediately generates questions about weather phenomena.
Books to Pair with Weather and Climate Lessons
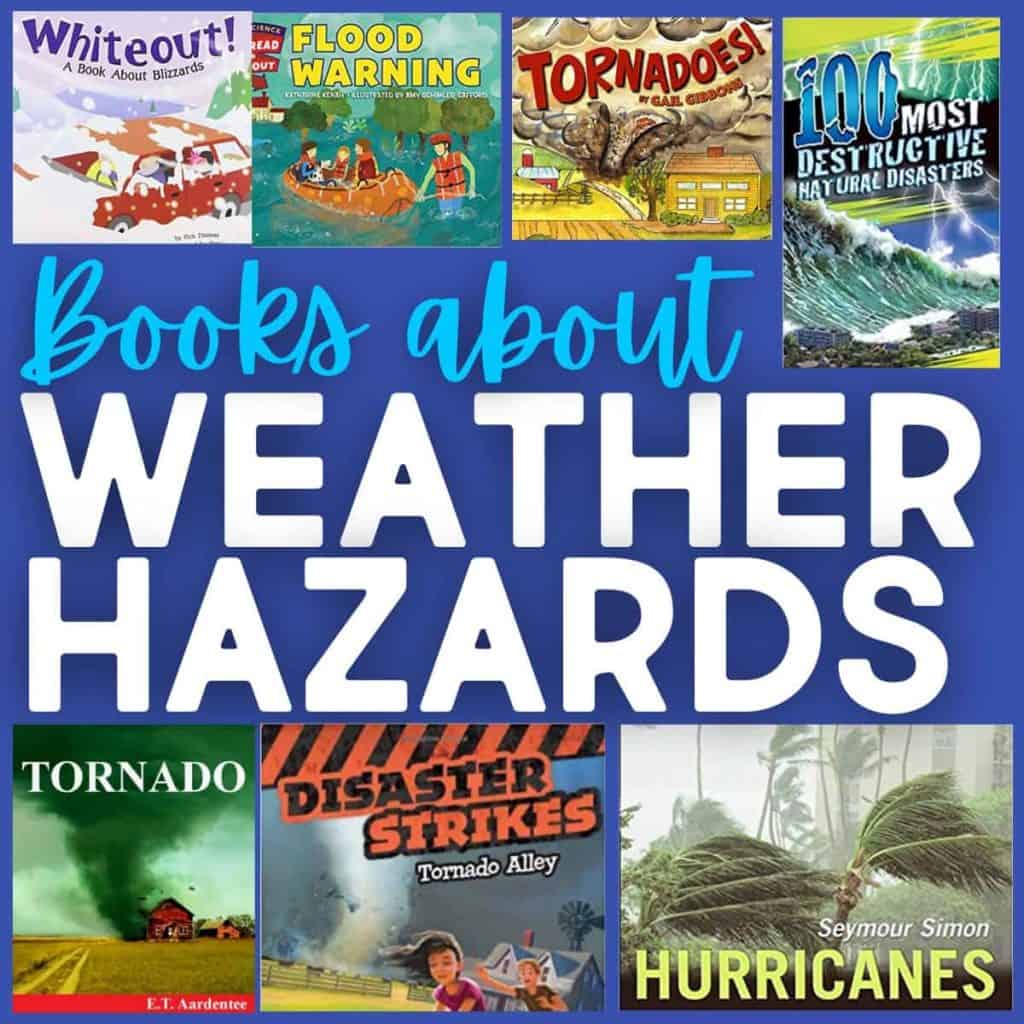
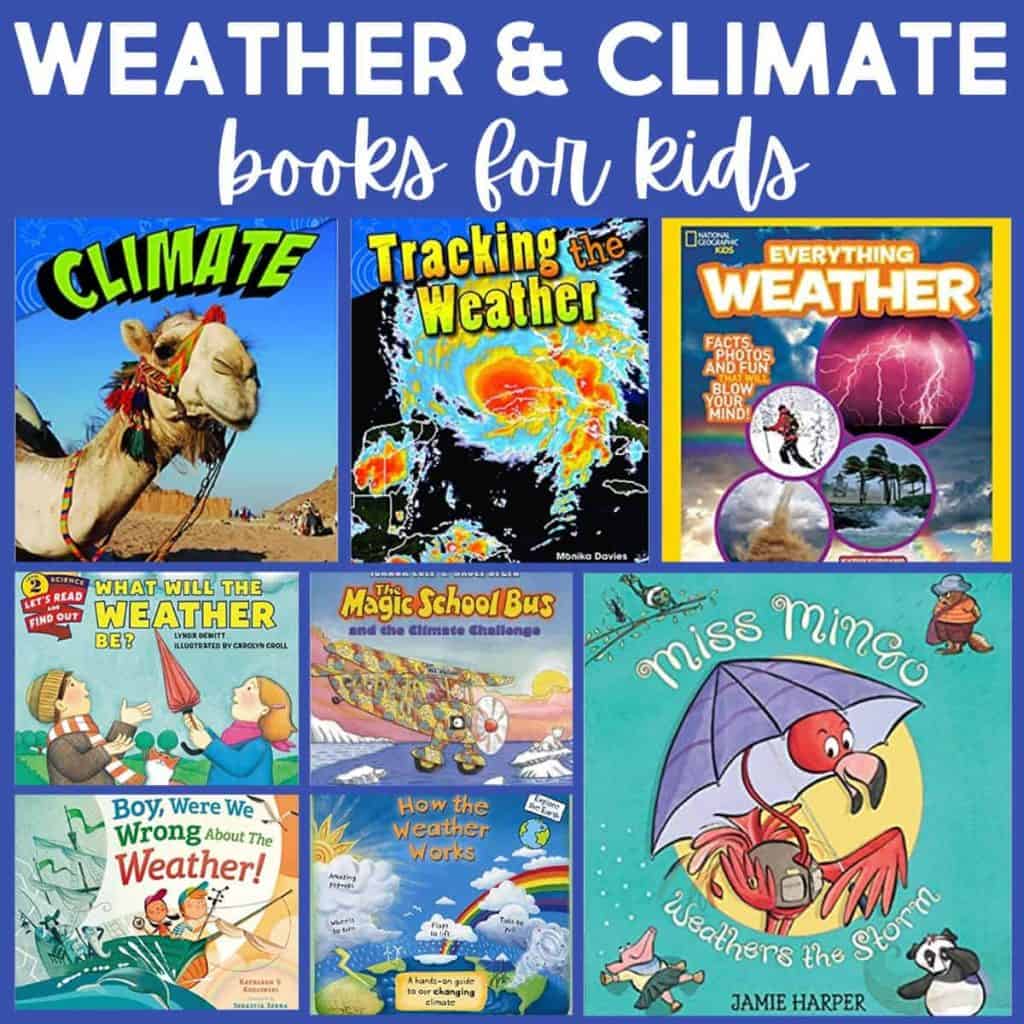
Pairing nonfiction read-alouds with investigations builds the vocabulary and conceptual background students need to interpret data independently. This curated list of books on weather for elementary science lessons includes both fiction and nonfiction, organized by concept.
For the climate vocabulary side of the unit, the climate vocabulary activities post has structured word work that helps students move from recognizing climate terms to using them accurately in writing and discussion.
How to Sequence a Weather and Climate Unit
The three standards build naturally on each other, and the sequence matters. Start with local weather observation and data collection (3-ESS2-1), cloud journals, the evaporation graphing activity, and daily weather recording. Students need a concrete data set before they can reason about patterns.
Once students have a feel for local weather patterns, zoom out to climate comparison (3-ESS2-2). The weather maps activity, the ocean currents mapping, and the rainshadow diorama all belong here. Students discover that climate varies by region and that predictable factors, geography, ocean currents, and global wind patterns explain why.
Close the unit with the engineering design challenge (3-ESS3-1). By the time students get to this standard, they should understand multiple weather hazards well enough to evaluate design solutions thoughtfully. The flood simulation, hurricane tracking, and drought research activities give them specific hazards to reason about. The goal is a claim supported by evidence, not just “levees are good” but “levees reduce flood damage by keeping water out of low-lying areas, which protects both homes and farmland.”
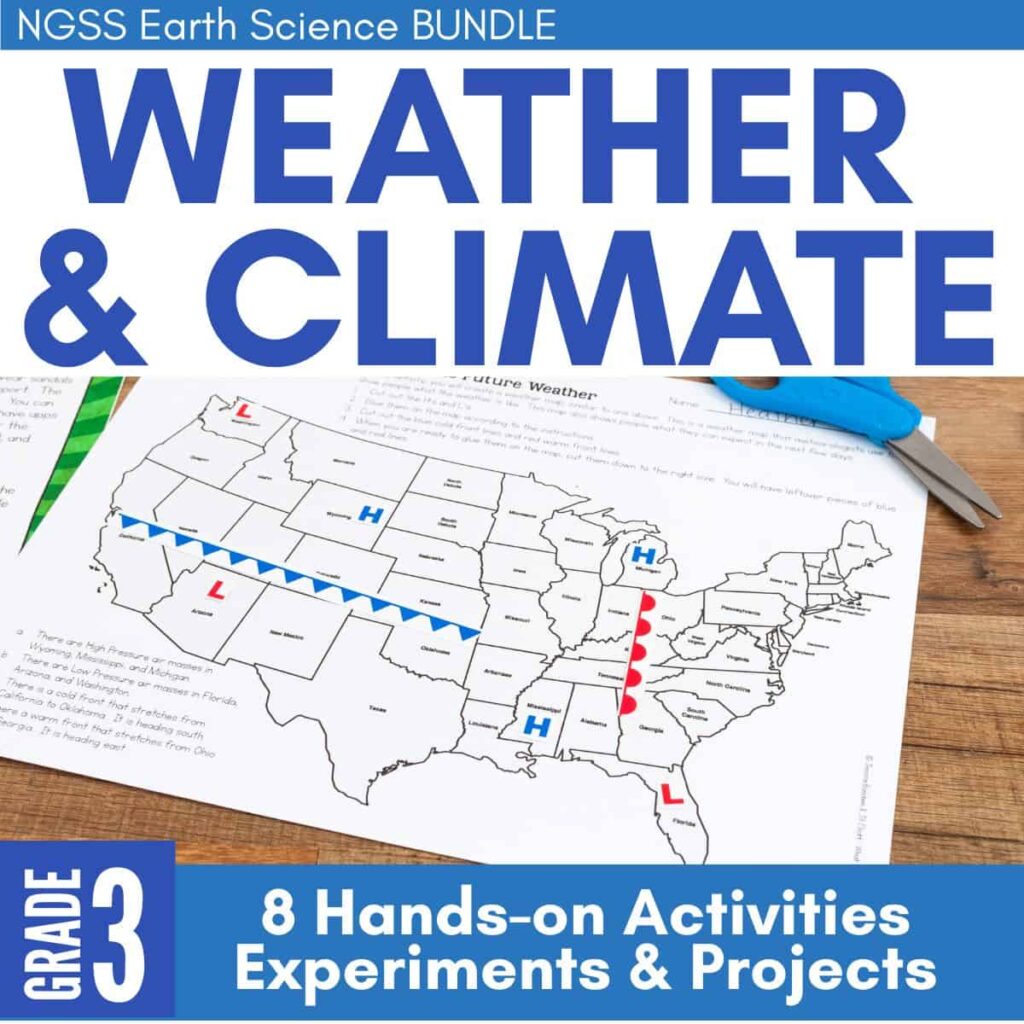
Weather and Climate Third Grade Science Stations
The focus is on NGSS 3-ESS2.D & 3-ESS3.B and includes concepts such weather, climate, severe weather, how clouds are formed, meteorology and weather maps, types of precipitation, meteorological tools, and climate zones.
Bringing It All Together
A strong weather and climate unit gives students both the observational tools to collect and represent data and the broader understanding of why climate varies across the globe. When the engineering design challenge comes at the end of that progression, students can make genuinely reasoned claims about hazard solutions, not just describe a product but evaluate it. That’s exactly what 3-ESS3-1 asks for, and it’s the kind of scientific thinking that carries forward into every unit after this one.
This post is part of the Earth Science for Elementary Students pillar on What I Have Learned Teaching.

I love this but is there a way to print it all out? I need to have it in front of me. Or is it available to purchase? Thanks!
Thanks! Some of the activities are available for purchase and are linked in the post above. The individual stations can be purchased on TPT.