
What Is a Tape Diagram? Examples for Every Math Operation
Tape diagrams are visual tools that help students solve math word problems. They offer a simple way to understand complex mathematical concepts.
In this post, I will discuss tape diagrams and how to use them in the elementary classroom, from kindergarten through fifth grade. I will also provide examples of tape diagrams for addition, subtraction, multiplication, and division word problems.

What is a Tape Diagram?
A tape diagram is a visual model that uses rectangles to represent the parts of a word problem. Each rectangle, or piece of tape, shows a quantity, and the rectangle sizes match the amounts they represent. Tape diagrams help students understand, interpret, and solve word problems. They are also called strip diagrams, bar models, fraction strips, or length models.
A tape diagram is a simple yet powerful math tool that helps students understand, interpret, and solve word problems. Tape diagrams can also be called strip diagrams, bar models, fraction strips, or length models.
This tool uses varying lengths of rectangles, or ‘tapes’, to depict mathematical relationships and reveal parts of an equation. Each part, or segment, of the tape represents a component of the problem.
The entire tape represents the whole or total, and each segment represents a part. The rectangle sizes proportionally match the quantities they represent, allowing clear visual comparison and understanding of the equation.
Tape Diagram vs. Strip Diagram vs. Bar Model: What’s the Difference?
A tape diagram, a strip diagram, and a bar model are the same tool with different names. All three use rectangles to show the parts of a word problem and how they relate to the whole.
The name you hear usually depends on your curriculum. Tape diagram is the term used in Common Core and Eureka Math. Strip diagram is common in Texas classrooms because it appears in the TEKS standards. Bar model comes from Singapore math programs. If your district switches curriculum and the vocabulary changes, the tool and the thinking behind it stay exactly the same.
Whichever name your standards use, the strategies in this post apply. I use the term tape diagram throughout, but every example below works the same way as a strip diagram or bar model lesson.
Tape Diagrams by Grade Level: Prerequisite Skills
To use a tape diagram, students need a conceptual understanding of number quantities. This key number sense skill transfers to solving operations. This conceptual understanding looks different at each grade level.
Students generally move from concrete representations, like physical objects, to pictorial representations, to visual representations, like drawing dots, to abstract representations, like a box. A tape diagram is abstract, but students can use visual representations to understand quantities in tape diagrams.
In kindergarten and first grade, students work with concrete objects and then move to representational drawings. At each step, place a circle or box around the objects to show they are a group. Be sure to add a digit that represents that number.
In second and third grade, students are introduced to multiplication and division. Their understanding of quantities is now in the form of equal groups. Students will revert to drawing discrete objects to deepen their understanding of equal groups.
A similar situation will occur when students are introduced to fractions. They will need to return to using objects to represent the fractions.
Our goal as math teachers is to move students toward efficiency. Tape diagrams help students represent their mathematical thinking and move toward more efficient models.
How do you use a Tape Diagram in Math?
To use a tape diagram, start by identifying the components of the problem. Each component will be represented by a rectangle, or ‘tape’ on the diagram. Each ‘tape’ length is then adjusted to represent its relative value in the problem.
When tackling problems with tape diagrams, students must start by asking themselves, “Do I know the entire amount?”
If it’s given in the problem, go ahead and fill it in. If not, simply use a question mark at the bottom of the diagram. Then, carefully examine the other information in the word problem and fill in those details.
How do you draw a tape diagram?
While there are conventions for drawing tape diagrams, there is some variability in how to draw one. Here are some key components:
- Rectangles will represent quantities.
- Rectangles will be labeled with a number, although they may also contain a visual representation like dots.
- The quantities will most likely have labels corresponding with the word problem’s context. Note: I do not label the quantities below.
- A question mark generally represents unknowns.
- The total or the whole can be represented as a rectangle or a bracket.
- Brackets are also used to show groups that are counted.
Questions to Ask Students When Working with Tape Diagrams
To develop students’ mathematical thinking when they work with word problems and tape diagrams, consider helping them internalize some questions about the problem. I have quite a few blog posts about how to solve word problems by problem type and go through a process of understanding the context of word problems.
To help students start to draw what they understand in the word problem, consider asking these open-ended questions;
- Can I draw something?
- What can I label?
- What do I see?
- How are these numbers related?
Examples of Tape Diagrams in Elementary Math
Let’s look at a few examples of how tape diagrams can be used for different mathematical operations.
Using Tape Diagrams for Addition
Consider this joining result unknown word problem: Jack has 5 apples, and he buys 3 more. How many apples does he have now?
The tape diagram will have two segments; one representing Jack’s initial 5 apples and the other segment representing the 3 apples he added.

The total length of the tape represents the total number of apples Jack has, which is 8.
Once students can model a problem like this, hands-on puzzle practice with three-digit addition gives them a way to apply that same part-whole thinking to bigger numbers.
Another Addition Example of a Tape Diagram
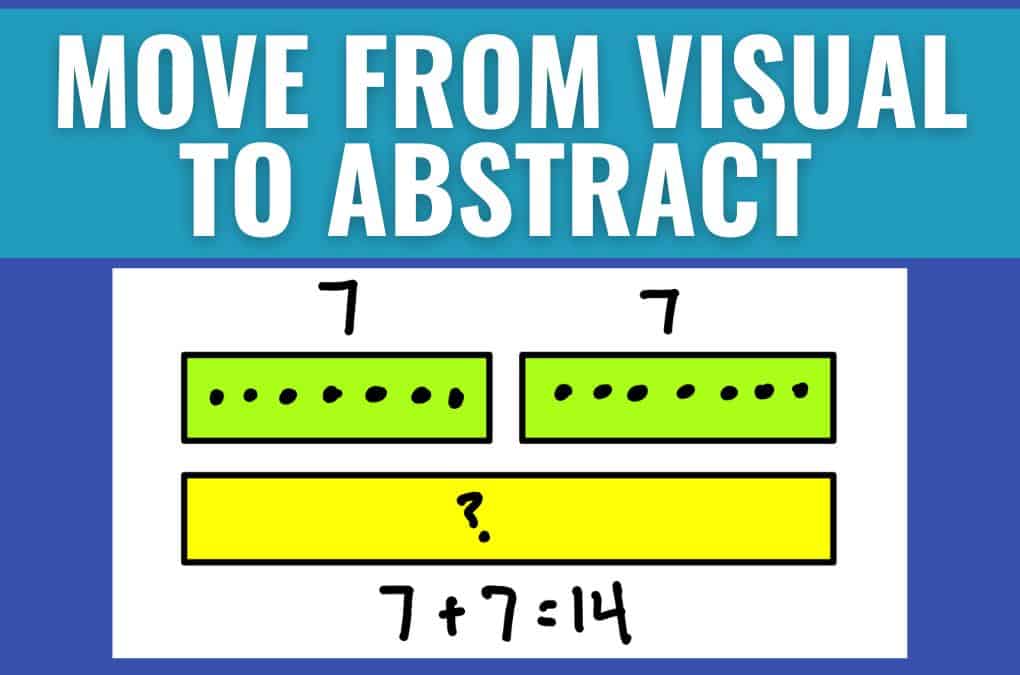
Most young students can represent 7 + 7 by drawing dots. To emphasize the part-part-whole relationship, line up the dots and draw a rectangle around 7 dots to represent each addend. Indicate the sum with a question mark. This moves students from representational draws of dots to labeling parts with a number, reinforcing the part-part-whole relationship of quantities in this visual model.
Fact family houses teach this same part-part-whole idea in a different format, so using both models together helps students see addition and subtraction as two sides of one relationship.
As students move into multiplication, they may revert to representational drawings, dots, and boxes because they lack a conceptual understanding of multiplication and division. Once students understand multiplication and division more deeply, they can move back to using numbers in their tape diagram. See below for examples of multiplication and division.
Using Tape Diagrams for Subtraction
For subtraction, imagine Sarah has 10 candies, and she gives 4 of them to her friend. How many candies does Sarah have left?
The tape diagram will start with a segment representing Sarah’s initial 10 candies. We will then “remove” or “subtract” a segment representing the 4 candies she gave away.
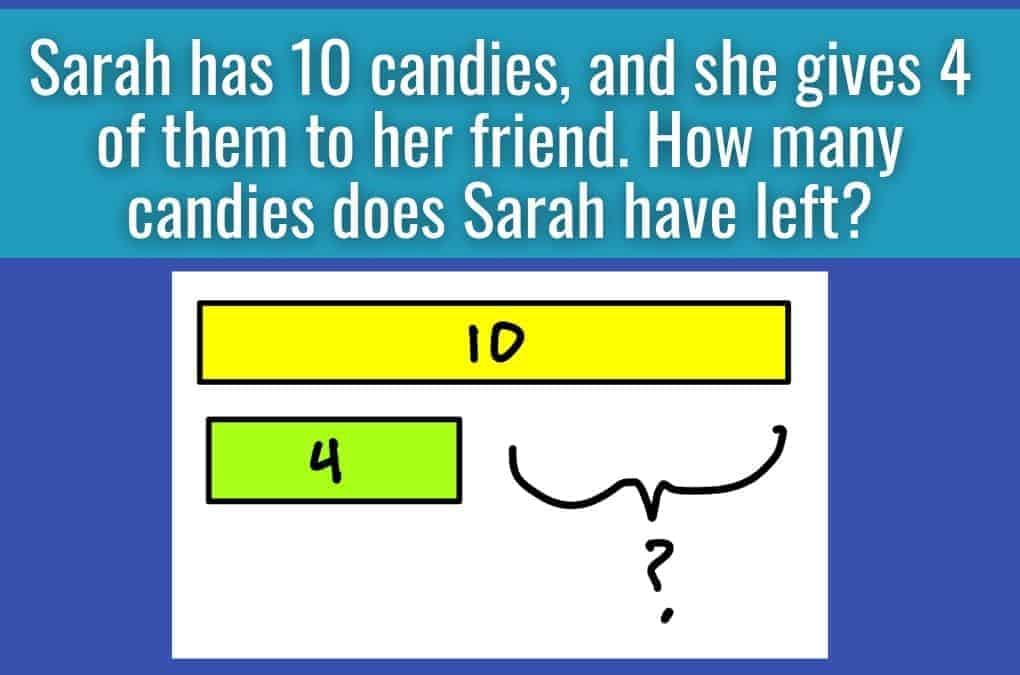
What remains in our diagram is 6, which is the number of candies Sarah has left.
Using Tape Diagrams for Multiplication
Here is an example of using a tape diagram for an elementary multiplication problem.
Suppose a flower pot holds 3 flowers, and there are 4 pots. How many flowers are there in total?
We would create a tape diagram with 4 equal segments (for each pot), each segment representing 3 flowers.

The total length of the tape represents the total number of flowers, which is 12.
Using Tape Diagrams for Division
For division, imagine there are 20 cookies that 5 children want to share equally. How many cookies does each child receive?
We start with a tape representing 20 cookies and divide it into 5 equal parts. Students can then distribute the cookies to each child. Since this is about distributing the cookies into equal groups, many students will start by drawing one or two cookies into each group, then go back to the beginning and draw one or two more until they have distributed all of the cookies.

Each segment (or child) gets 4 cookies.
Using Tape Diagrams for Fractions
Tape diagrams with fractions work similarly to a fraction number line.
Fractions: In the case of 3/4, you would divide a tape into 4 equal parts, then shade in 3 of those parts to represent the fraction.

To represent 3/4 of a whole number, students would draw the whole number, divide it into groups of 4 then count 3 of those groups.


Addition and Subtraction Word Problems: Teach the Types of Word Problems
Master addition and subtraction word problems with this year-long resource! Covers all types of word problems, including first grade addition word problems and 2nd grade subtraction word problems, with built-in differentiation, models, and vocabulary support.
When Students Struggle with Tape Diagrams
Two problems come up most often when students are new to tape diagrams.
The first is that students draw the rectangles without thinking about size proportionality. A tape diagram for 2 + 20 should have a visually larger segment for 20 than for 2 — the size is part of the meaning. When students make all segments the same length, they are treating the diagram as a label rather than a model. A quick fix: draw the problem together on the board first and explicitly narrate why one rectangle is longer. “We have 20 cookies and 2 cookies. Which group is bigger? So which rectangle should be bigger?”
Second, students cannot yet identify what is known and what is unknown. They read the word problem but do not know which quantities to put in the diagram and what to mark with a question mark. This usually means they are not yet reading the problem for meaning — they are scanning for numbers. Slow the process down: cover the numbers and ask students to tell you what is happening in the story. Once the story makes sense, the numbers have a place to go in the diagram.
The grade-level progression in the section above can help you see where a student is getting stuck. If a second grader cannot represent 8 + 5 with a tape diagram, they may still need discrete objects before the rectangular model makes sense.
Video about Using Tape Diagrams
For video support and supplemental resources on tape diagrams in elementary math:

A few other resources include:
- Khan Academy – Comparing Fractions
- PBS Learning – Modeling with Tape Diagrams
The shift from concrete to pictorial to abstract takes time, and tape diagrams live in the pictorial-to-abstract transition. A student who can draw a tape diagram is showing you that they understand the relationship between the quantities — not just the procedure for solving. That is what makes this model worth the upfront investment of time in grades 1–3.
Once students can draw a tape diagram for addition and subtraction, they have the conceptual foundation to extend the model to multiplication, division, and fractions in the same way — which is why the examples above span all five operations rather than stopping at addition.
How to Solve Word Problems By Problem Type
Tape diagrams work alongside a problem type approach to word problems. When students know whether a problem is a join, separate, or compare situation, they know how to set up the tape diagram — which part goes on the left, where the unknown goes, whether the question mark represents a part or the whole.
If you want to go deeper into teaching word problems by type, the 5 strategies for teaching word problems post is a good starting point. The How to Teach Word Problems course covers the full progression, with tape diagrams built into each problem type lesson..
How to Teach Word Problems by Problem Type
Still seeing students guess instead of truly understanding?
In this course, you’ll learn how to teach word problems step-by-step using clear problem types, visual models, and simple routines your students can actually follow.
No more keyword guessing. No more confusion.
You’ll get practical strategies, examples, and tools you can use right away to move students from confusion to confidence.
Jessica BOschen
Jessica is a teacher, homeschool parent, and entrepreneur. She shares her passion for teaching and education on What I Have Learned. Jessica has 16 years of experience teaching elementary school and currently homeschools her two middle and high school boys. She enjoys scaffolding learning for students, focusing on helping our most challenging learners achieve success in all academic areas.