
Shapes Anchor Chart: Teaching 2D and 3D Shapes
Every year around the geometry unit, the same thing happens: a student points at a square and calls it a rectangle, or names a cube a “square” because that is the flat shape they can see. A good shapes anchor chart is one of the quickest ways to clear this up. When students can look up a chart that shows each shape next to its name and attributes, the vocabulary starts to stick, and their descriptions become more precise.
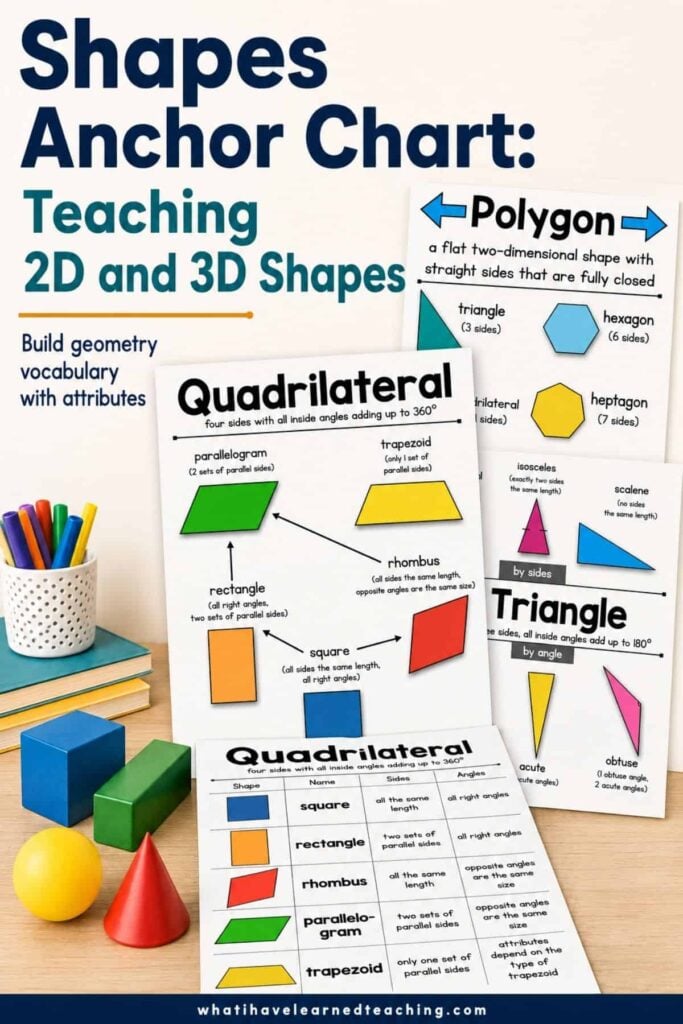
This post walks through how to build a 2D and 3D shapes anchor chart, how to organize it around attributes instead of just pictures, and how to use it so students actually reference it during independent work.
Why a Shapes Anchor Chart Works
Geometry is a vocabulary-heavy unit. Students are learning shape names, but they are also learning the words we use to describe shapes: sides, angles, vertices, faces, edges, parallel, right angle. A shapes anchor chart puts all of that in one place students can see. Instead of memorizing shapes as pictures, they start sorting them by what is true about them, which is exactly the kind of thinking the standards ask for.
The charts that work best have three things in common. They pair each shape with its name so students connect the two. They show the attributes that define the shape, not just a colorful drawing. And they stay up long enough for students to use them, ideally through the whole unit and into review. A chart students helped build, or one they can add to as the unit goes, gets referenced far more than one that appears finished on day one.
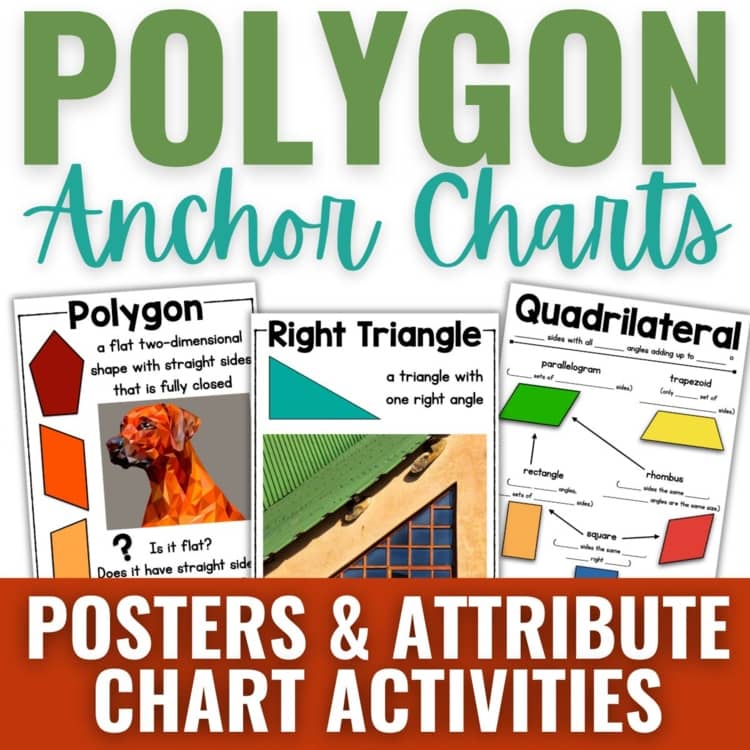
This Polygon Anchor Chart resource helps students build a strong understanding of polygons, quadrilaterals, triangles, and essential geometry vocabulary through colorful, easy-to-read reference posters.
Building a 2D Shapes Anchor Chart
Start with 2D shapes, and give students time with these before you introduce solids. A 2D shapes anchor chart should do more than just list circles, triangles, squares, and rectangles. The real learning is in the attributes, so organize the chart around them:
- Number of sides: A triangle has three, a quadrilateral has four, a pentagon five, a hexagon six.
- Number of angles (vertices): Students notice that the number of sides and angles always matches, which is a great discovery for them to make.
- Side length and angle size: This is what separates a square from a rhombus, or a regular hexagon from an irregular one.
- Parallel sides and right angles: The details that let students tell a trapezoid from a parallelogram, or a rectangle from a plain quadrilateral.
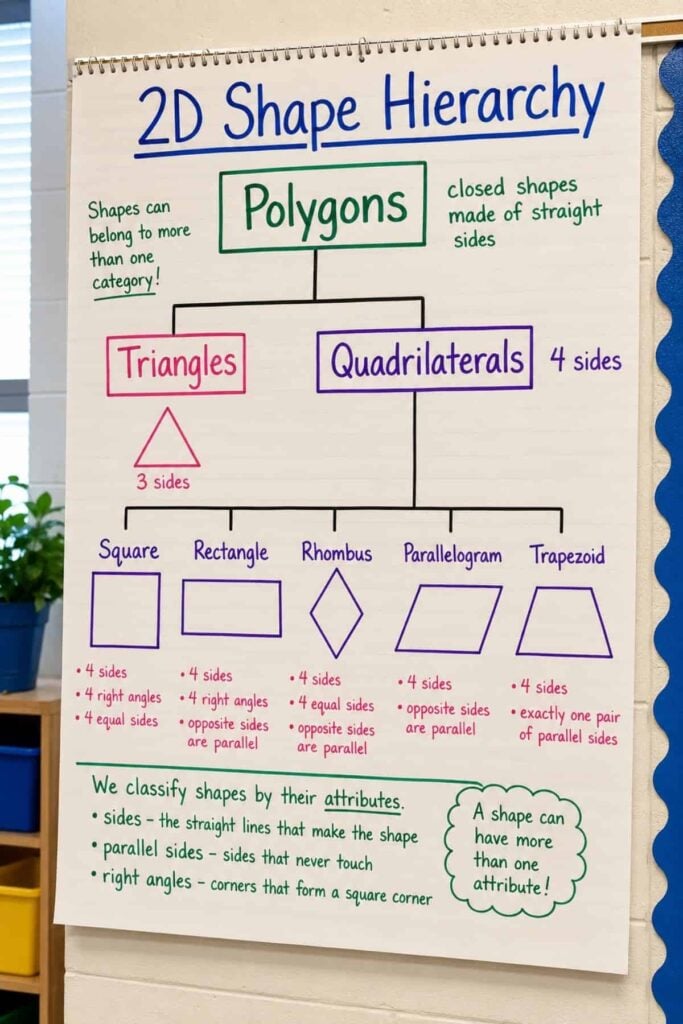
A move I like is building the chart as a hierarchy rather than a flat list. Put polygon at the top, then branch into triangles and quadrilaterals, then show the specific shapes underneath each. When students see that a square is also a rectangle, and a rectangle is also a quadrilateral, they start to understand that shapes are defined by their attributes, not by how they happen to be drawn. That is the idea behind the geometry hierarchy in the Common Core geometry standards, and it pays off when students reach the stage of classifying two-dimensional figures in later grades.
Building a 3D Shapes Anchor Chart
Once students can name and describe flat shapes, a 3D shapes anchor chart adds a new set of attributes. Solids are described by their faces, edges, and vertices, and those words trip students up because they are counting in three dimensions now. Anchor the chart to the same attribute-first structure:
- Faces: The flat surfaces. A cube has six, a cylinder has two flat faces and one curved surface.
- Edges: Where two faces meet. Counting edges on a cube is a satisfying hands-on task with a real solid.
- Vertices: The corners where edges meet. A sphere has none, which surprises students.
Connect each solid back to the flat shapes students already know: a cube is built from squares, a rectangular prism from rectangles, a pyramid from triangles and a base. When the 3D chart sits next to the 2D chart, students can trace a solid back to its faces, and the two charts reinforce each other. Hand students actual geometric solids while they build, or have them reference the chart, so they can feel the faces, edges, and vertices they are counting.
Teaching 2D and 3D Shapes by Grade
The same shapes anchor chart grows in depth as students move up the grades. Match the chart to where your students are:
- Kindergarten and 1st grade: Focus on naming 2D and 3D shapes and noticing sides and corners. Keep the chart simple, with a clear picture and name for each shape.
- 2nd grade: Students count and compare sides and angles, and start recognizing shapes by their attributes rather than their look. This is also where partitioning shapes into equal parts comes in.
- 3rd and 4th grade: Students classify quadrilaterals, work with parallel sides and right angles, and sort triangles by their sides and angles. The chart gets more detailed, and the vocabulary gets precise.
- 5th grade: Students place shapes in a hierarchy and reason about which properties are shared, like understanding that all squares are rectangles.
If you are teaching where geometry meets measurement, my partitioning rectangles into rows and columns post is a natural companion once students can name and describe the shapes themselves.
Ways to Use a Shapes Anchor Chart
A chart only helps if students use it. A few ways to keep it working past the day you make it:
- Build it with students. Add shapes and attributes as you teach them, rather than posting a finished chart. Students reference what they helped create.
- Give a personal copy. A smaller version taped inside a math folder or notebook travels with students to independent work and centers.
- Use a fill-in-the-blank version. Turn the chart into a check-for-understanding by leaving the attributes blank and having students complete it.
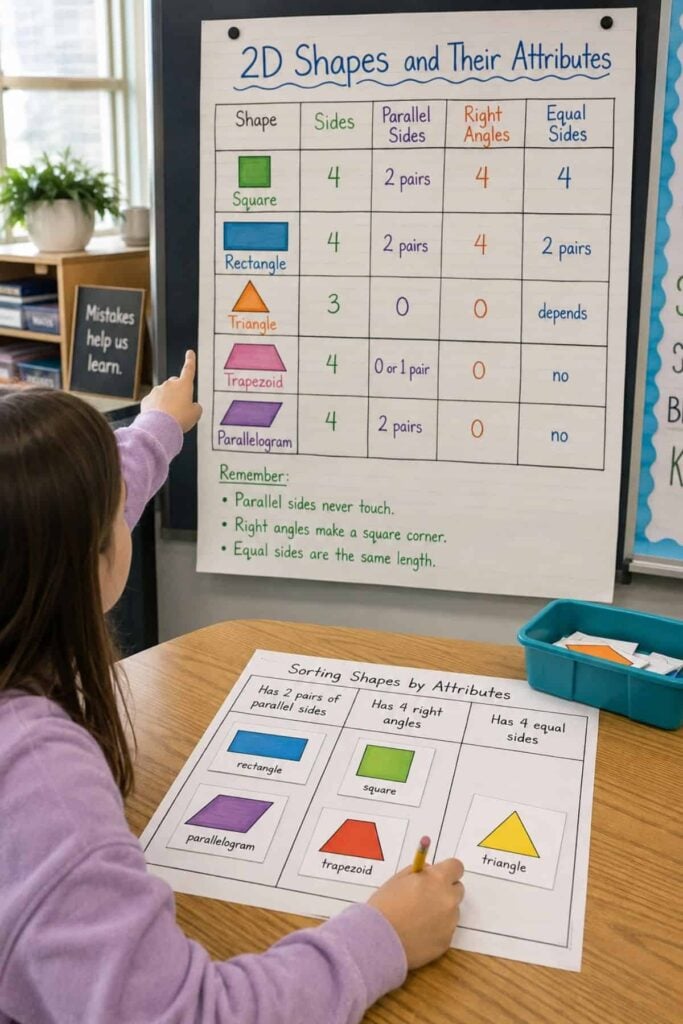
- Sort and match. Have students match shapes to attribute cards, or sort a pile of shapes using the chart as their reference.
Frequently Asked Questions
Bringing It All Together
A shapes anchor chart is a small thing that carries a whole geometry unit. Build it around attributes, start with 2D shapes before solids, and keep it up where students can reach for it during independent work. When the chart does the remembering, students are free to do the thinking.
This Polygon Anchor Chart resource helps students build a strong understanding of polygons, quadrilaterals, triangles, and essential geometry vocabulary through colorful, easy-to-read reference posters.
Want a set that is ready to print? My Polygon Anchor Charts and Activities include individual posters for polygons, quadrilaterals, and triangles, attribute charts that build the shape hierarchy, and fill-in-the-blank versions students complete to show what they know. It pairs well with my measurement and geometry cut and paste activities for hands-on practice with attributes.
Jessica BOschen
Jessica is a teacher, homeschool parent, and entrepreneur. She shares her passion for teaching and education on What I Have Learned. Jessica has 16 years of experience teaching elementary school and currently homeschools her two middle and high school boys. She enjoys scaffolding learning for students, focusing on helping our most challenging learners achieve success in all academic areas.